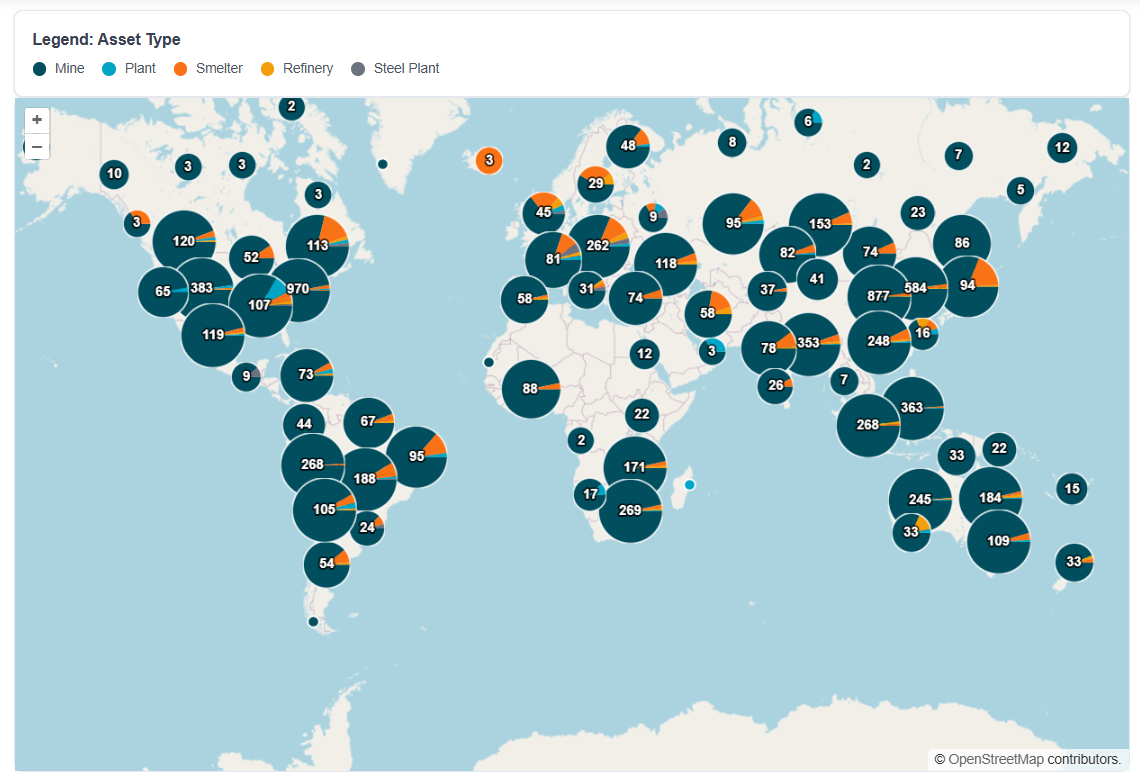
Last year, the International Council on Mining and Metals (ICMM) published the Global Mining Dataset, the most comprehensive publicly available compilation of mining and metals facilities in the world. It brings together thousands of mines, refineries, smelters, and processing plants across 47 commodities, mapping where they are, what type of facility they are, and what they produce. It is a genuine milestone for transparency in a sector where even basic figures have long been hard to pin down.
Soon after its release, Auyan built an interactive map inside our Data Explorer so anyone could access and interact with it. The response from the community was fantastic, and the strong feedback we received helped us improve the data visualisation tool.
Today, ICMM announced the release of Version 1.5 of the Global Mining Dataset, and it is a meaningful step up in both quality and depth. We are proud to share that we have worked with ICMM on this improvement. Two things make this release special: every site has now been through a rigorous geospatial validation carried out by Auyan's team, and the dataset is released alongside a new water-related dataset (named Global Mining and Metals Water Dataset), with the analysis led by the University of Technology Sydney. This post offers an overview of the work carried out by Auyan, plus a closer look at what changed between v1.0 and v1.5.
What's new: a fully validated dataset
Working alongside ICMM, we put the entire dataset through a multi-stage validation pipeline for Version 1.5, checking that each site really sits where its coordinates say it does. Without going too deep into the technical details, here is the essence of how it works:
- We searched for potential duplicates by comparing geolocations, commodities, and site or owner names. Duplicates were flagged for manual review at a later stage.
- We cross-referenced every coordinate against trusted global mining datasets, using established sources from the scientific literature and OpenStreetMap.
- We screened the surrounding land use with geospatial imagery, which quickly catches sites that appear to sit in open water, dense forest, or the middle of a city.
- We analysed satellite imagery, combining Sentinel-2 (multispectral) and Sentinel-1 (radar), and passed it through machine-learning models that flag features and locations which simply do not look like a mining asset.
- Finally, our analysts carried out expert manual review on high-resolution satellite imagery to resolve the ambiguous cases and potential duplicates that automation alone cannot settle. They also double-checked any flagged site to avoid false negatives.
What we found
The exercise gave us a clear picture of the dataset's strengths and allowed us to smooth out its rough edges:
- 10,604 sites were confirmed, with unambiguous evidence of mining or processing infrastructure.
- Around 2,994 entries were flagged as incorrect locations, pointing to residential areas, untouched nature, or even open ocean.
- 376 duplicate records were identified and tagged, so they can be cleanly merged.
- 66 sites were flagged as likely inactive, showing evidence of revegetation or abandonment.
As a result, the curated dataset contains over 12,000 facilities (mines, smelters, refineries and plants), the confirmed and likely sites retained from the 15,188 we assessed.
The validation of the sites was performed following a pre-defined classification:
- Confirmed: The site is either visually confirmed on its given location (<500m) with high resolution satellite imagery check or has several datasets/analyses confirming its location.
- Likely: The site is either visually confirmed around the given location (between 500m and 20km) or confirmed through automated satellite imagery analysis.
- Incorrect: No evidence (either in geospatial datasets or satellite imagery) found.
- Requires Further Review: No evidence (either in geospatial datasets or automated satellite imagery) but manual check led to finding an ambiguous site our team could not assess with high certainty as a facility.
We analysed how the original "Confidence" labels in v1.0 correlated with our validation findings. Those labels proved a reliable guide: sites marked as high confidence held up very well, while very low confidence ones were less reliable.
High Confidence Sites: The v1.0 data was very accurate. 90.7% of sites labelled "High Confidence" were Confirmed, with only 4.1% found to be Incorrect, a real credit to the quality achieved by ICMM in V1.0.
Low/Very Low Confidence Sites: The accuracy dropped here. In the "Very Low Confidence" category, about 44% of the sites were found to be Incorrect. This shows why the curation was worthwhile but more importantly it confirmed the confidence level of V1.0 as a strong data quality indicator.
| Initial Confidence in V1.0 | Confirmed | Likely | Incorrect | Requires further review | Total Sites | Accuracy Rate (%) |
|---|---|---|---|---|---|---|
| High | 2,866 | 155 | 131 | 8 | 3,160 | 95.6% |
| Moderate | 3,626 | 341 | 555 | 10 | 4,532 | 87.5% |
| Low | 3,450 | 801 | 1,597 | 23 | 5,871 | 72.4% |
| Very Low | 662 | 252 | 711 | 0 | 1,625 | 56.2% |
| Total | 10,604 | 1,549 | 2,994 | 41 | 15,188 | 80.0% |
Table 1: Data Accuracy vs. Initial Confidence Level. Accuracy Rate defined as (Confirmed + Likely) / Total.
One insight we found particularly interesting: data quality varied considerably by commodity. Bulk commodities like coal and iron ore, and tightly regulated ones like uranium, had the most reliable coordinates. Smaller-footprint operations, such as tin, silver, and tungsten, showed higher error rates, largely because such sites are not represented in external datasets, have a shorter lifespan, and are harder to verify from space.
More information and analysis can be found in the official GMD V1.5 report.
New: water data and insights
A new domain is now covered by ICMM's dataset: water. Built on the geo-validated and curated v1.5 dataset, with the analysis led by the University of Technology Sydney, this new dataset sheds light on the relationship between mining and metals facilities and the water systems around them.
Through this analysis, UTS found that nearly two-thirds of the world's mining and metals facilities sit in catchments that already carry a high level of at least one physical water risk. In other words, water is not a peripheral concern for the mining sector. It is a material issue, and it bears directly on the minerals and metals the world needs for the energy transition.
The dataset maps where these facilities intersect with five key physical water quantity indicators: baseline water stress, baseline water depletion, drought risk, flood risk and interannual variability. Bringing these layers together gives a clear, site-level view of where water pressure and mining activity meet.
The water dataset and its accompanying report show that competition for water, between mining and metals operations and other industrial and domestic users, is the single greatest physical water risk facing the industry. That points to a clear priority: coordinated, integrated land and water use planning at regional scale, which will only grow in importance as demand rises for the materials behind clean energy systems.
Minerals and metals are essential to a low-carbon future, yet this analysis makes something plain: the conditions needed to produce them are constrained by real, physical water risks. Understanding those constraints is the first step to managing them well.
The Global Mining and Metals Water Dataset also comes with a detailed report providing further insights and analysis.
Acknowledgements
This release is a huge step forward in making mining more responsible, sustainable, and transparent. It is the product of a genuine collaboration, and we want to acknowledge everyone who made it possible. Our thanks go to ICMM for building the Global Mining Dataset and for working so openly with us to improve it, and to the University of Technology Sydney for the water analysis and insights that enrich Version 1.5. We are also proud of the work our own team put into the geospatial validation. Auyan stands ready to support future data curation, expansion, and analysis with our expertise and tools.
Let's build this together
At Auyan, we see this dataset as a living project, best improved through community collaboration. If your organisation has data, insights, or an interest in contributing, we would love to partner with you. And if you are part of the wider community with an idea for a new feature, a suggestion to improve the data access and visualisation, or something in the data that needs a second look, we want to hear it.
By working together, we can build a more transparent and sustainable future for the mining industry. Feel free to Share your ideas or collaboration proposals with us or ICMM.
Thank you for being part of this journey. We can't wait to see the insights you uncover.
The Auyan Team